In this article
Documentation
How can I compare metrics?
- Aert
- 854 Pageviews
The statistics dashboard has a default of a 7-day range, with the last day being the last full day available. The compare block will by default compare the metrics of the last 7 days to the previous 7 days.
For example, if today is 15th of June:
- The compare block will show the data of 8 – 14th of June.
- The differences are shown as percentages, which can be positive or negative in relation to the data of 1 – 7th of June.
Explaining the Metrics
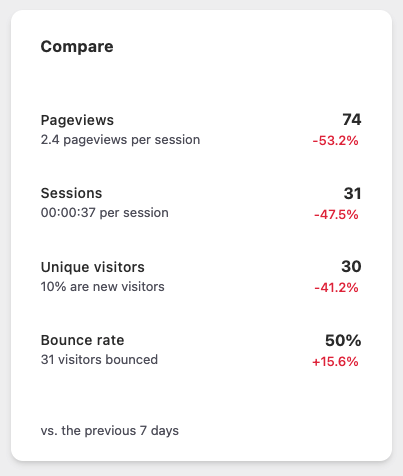
These are the current, essential metrics available in the comparison block. We will explain them shortly from top to bottom;
Pageviews
- A pageview is every page visited by a website visitor.
- The amount of pageviews per session is the average of the pages visited by your website visitor during a session.
Session
- A session is a website visit of one visitor that contains 1 or more pageviews until midnight. A session ends after an exit or a significant time out on a page. A website visitor can have multiple sessions on a day.
- The time per session are (hours)(minutes)(seconds) on average for one session.
Unique visitors
- Unique visitors counts the unique entries of a website. As the above graph shows one session more than unique visitor. One unique visitor had 2 sessions
- New visitors are visitors that have not yet visited your website, but they can also use a new browser, incognito window or device.
Bounce rate
Want to know about Bounce Rate, and how you can configure it? Read this article.
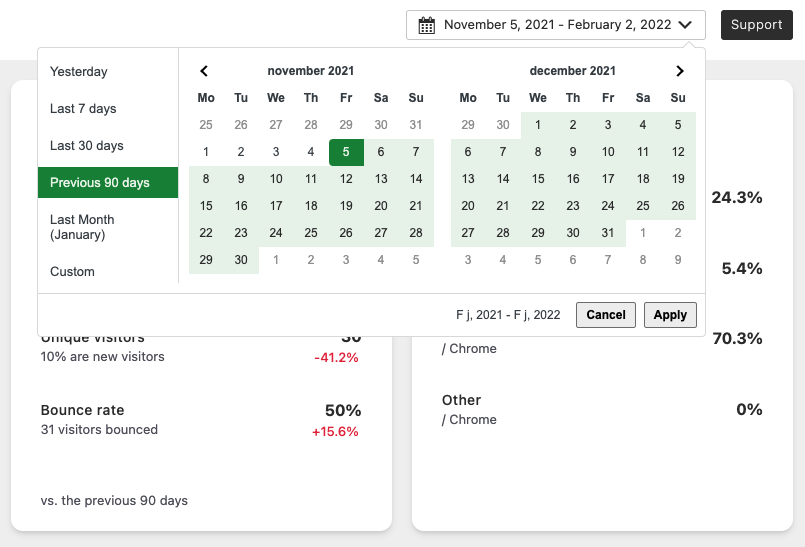
Extending the Comparison Range
You can easily change the range of the data by using the date picker. To extend the range to 90 days:
- Know your website visitors
Enhance your understanding of website visitors! Track country data, URL parameters, and multiple goals. Plus, enjoy premium support whenever needed!